分类
English 原创作品 技术

IBM FileNet Case Analyzer Cubes’ Deep Customizations, Part 2: Organization-user drill up or drill down

IBM FileNet Case Analyzer Cubes’ Deep Customizations

Part 2: Organization-user drill up or drill down

Utilize OLAP parent-child relationship to enhance CA user dimension

3/19/2012

IBM

Er Xing Zhao & Yiwei Song

This is part 2 of the series, continues to fulfill report requirements in part 1. Case Analyzer cubes contain a User dimension which includes all users participated in processes. Various reports can be created base on this. However if organizational information is needed in the reports, CA User dimension is not sufficient. This part leverages OLAP parent-child relationship and LDAP, shows how to impghs Aement an organization-user dimension that can drill up or drill down.

ErXing Zhao, a member of IBM CDL ECM CoE (Center of Excellence) in China. Has rich experience in Enterprise Content Management and Business Process Management since 2007 as a developer and architect. Reach out to him at zhaoerx@cn.ibm.com

Yiwei Song, a member of CDL ECM CoE (Center of Excellence) in China, certified FileNet (4.0) developer. Has 5 years FileNet engagement experience, especially familiar with FileNet BPM. Acted as product expert and served several customer cases across insurance, banking and E&U industries. You may reach him at http://linkedin.com/in/yiweisong.

Link to the first part of the article:

Part 1 on Evis.ME | Part 1 on developerWorks

This part of the series produces the report: Monthly ongoing/completed tasks by branch/sub-branch.


Requirement analysis

This report implies 3 factors: task amount, time period and branches list. The task amount measure and the time dimension is already in CA cubes. CA lacks of a branch dimension.

According to the organization chart, XYZ Insurance’s organizational units and employees form a hierarchical tree. A hierarchical tree best fits an OLAP dimension with drill up or drill down capabilities.

It’s not necessary to create a brand-new dimension, which would mean creating a full set of dimension table and foreign key relationships with fact tables. CA provides the User dimension as well as its underlying dimension table D_DMUser. Multiple fact tables like F_DMQueueLoad contain foreign key to it. It’s possible to append organization hierarchies to D_DMUser and then to derive a new dimension.


Parent-child relationship in OLAP

An OLAP dimension may contain parent-child hierarchies. According to Microsoft TechNet document (http://technet.microsoft.com/en-us/library/ms174846(SQL.90).aspx), a parent-child hierarchy is a hierarchy in a standard dimension that contains a parent attribute. A parent attribute describes a self-referencing relationship, or self-join, within a dimension main table.

Figure 1. A sample dimension table presenting parent-child hierarchy

image

(http://i.technet.microsoft.com/ms174846.13317b8b-3540-48fd-b194-e287f0bddc12(en-US,SQL.90).gif)


Extending CA user dimension table

The User dimension in CA OLAP only provides a flat view of users who participate in the processes. The dimension has to be extended by applying the parent-child hierarchy.

When customizing the OLAP model, it is best to modify the CA built-in tables/cubes as little as possible. So when needed, it’s better to create new tables or dimensions rather than modifying existing ones.

In this article, CA data are stored in CADB database in SQL Server 2005. Below are two tables to be created in the same database. (D_DMUser is a CA built-in table, it’s only listed here as reference.) EX_DMOrg will be used for storing organizational unit entries, the ParentKey column records parent-child relationship within the table; while EX_DMUserOrg stores the one-to-many relationship between organizational units and users. Note that DMUser_key is an auto-increase primary key in EX_DMOrg, and it has an increase step of -1.

Figure 2. New tables supporting parent-child hierarchy

image

Then a database view EX_DMUser is created consuming newly created tables EX_DMOrg, EX_DMUserOrg and the CA table D_DMUser. The SQL of the view is as follows:

Listing 1. SQL of database view EX_DMUser

SELECT DMUser_key, DisplayName, Userid, UserName, NeedsUpdate, ParentKey, OrgLevel

FROM (

SELECT DMUser.DMUser_key, UserOrg.DisplayName, DMUser.Userid, DMUser.UserName,

DMUser.NeedsUpdate, UserOrg.ParentKey, UserOrg.OrgLevel

FROM dbo.D_DMUser AS DMUser LEFT OUTER JOIN dbo.EX_DMUserOrg AS UserOrg ON

DMUser.UserName = UserOrg.UserName

UNION ALL SELECT DMUser_key, DisplayName, Userid, UserName, NeedsUpdate,

ParentKey, OrgLevel

FROM dbo.EX_DMOrg AS Org

)

WHERE (OrgLevel > 0)

Looking into above SQL, it joins D_DMUser with EX_DMUserOrg on the UserName column. Then all EX_DMOrg and expended D_DMUser data are put together via a union. In this union operation, EX_DMOrg and D_DMUser both have the primary key DMUser_Key; however the values won’t have any overlap, since the former has negative integer value, while the later has positive integer value. By such design, organizational unit entries and user entries are all mixed up. The foreign key ParentKey of the view points to the primary key DMUser_Key of itself. As a result, the corresponding parent-child relationship is applicable to both organizational units and users. The diagram below shows relationships among the three tables inside the view.

Figure 3. Logical structure of the EX_DMUser view

image

This view EX_DMUser is the base of the new dimension.


Importing user-organization info from LDAP using UserOrgSync application

By now, newly created dimension tables are still empty.

Bring up the UserOrgSync project mentioned in part 1 of the series. Make sure the project is compiled successfully and configurations are adjusted accordingly. Now run the JUnit test case:

  • com.ibm.cn.ecm.ca.ProcessAnalyzerServiceTest.testImportOrgAndUser()

Once it is successfully executed, the EX_DMUser view is filled with the following data.

Figure 4. UserOrgSync application imports data into EX_DMUser view

image

The import is not a one-shot action; the importer will be run regularly in order to reflect to latest organizational structure of the company. It is recommended to wrap the importer by some system service, so that it can be run manually or periodically by some scheduler.


Updating CA cubes with the new user-org dimension

This section will create a new dimension based on database view above and apply it to the CA cubes.

Bring up the Microsoft SQL Server Business Intelligence Development Studio (BI Studio for short), open the existing Analysis Services Database.

Figure 5. Open existing Analysis Service database in BI Studio

image

Choose the only database at localhost server.

Figure 6. Choose a Analysis Service database to open

image

Open the Data Source View: VMAE.

Figure 7. The VMAE Data Source View

image

Add the EX_DMUser view from menu.

Figure 8. Add tables to data source view

image

Include the newly created EX_DMUser view and click OK.

Figure 9. Add newly created EX_DMUser to data source view

image

Find the EX_DMUser in the view, set the DMUser_key as Logical Primary Key.

Figure 10. Set Logical Primary Key of the view

image

Check the relationships connected to original D_DMUser, double-click the line or right-click the line then choose Edit Relationship.

Figure 11. Check incoming relationships of D_DMUser

image

There’s no necessary to modify the existing relationships, just remember it.

You may find there are 7 incoming relationships targeting D_DMUser in CA OLAP (fewer in PA):

  • F_DMCaseLoad.DMUser_key -> D_DMUser.DMUser_key
  • F_DMCaseWIP.DMUser_key -> D_DMUser.DMUser_key
  • F_DMTaskWIP.DMUser_key -> D_DMUser.DMUser_key
  • F_DMRouting.DMUser_key -> D_DMUser.DMUser_key
  • F_DMWIP.DMUser_key -> D_DMUser.DMUser_key
  • F_DMQueueLoad.DMUser_key -> D_DMUser.DMUser_key
  • F_DMProductivity.DMUser_key -> D_DMUser.DMUser_key

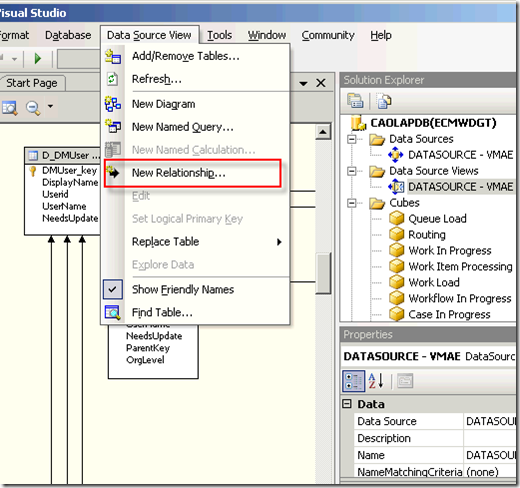
Comparing this, create new relationships for EX_DMUser:

  • F_DMCaseLoad.DMUser_key -> EX_DMUser.DMUser_key
  • F_DMCaseWIP.DMUser_key -> EX_DMUser.DMUser_key
  • F_DMTaskWIP.DMUser_key -> EX_DMUser.DMUser_key
  • F_DMRouting.DMUser_key -> EX_DMUser.DMUser_key
  • F_DMWIP.DMUser_key -> EX_DMUser.DMUser_key
  • F_DMQueueLoad.DMUser_key -> EX_DMUser.DMUser_key
  • F_DMProductivity.DMUser_key -> EX_DMUser.DMUser_key
Figure 12. Create new relationship

image

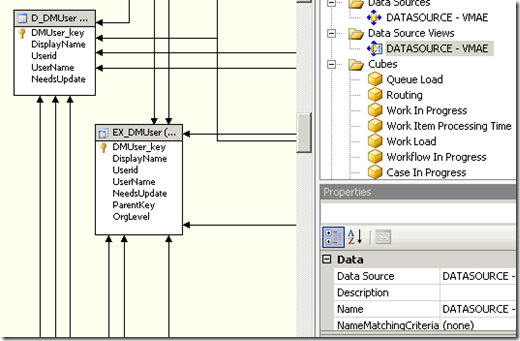
As a result:

Figure 13. Create similar relationships for EX_DMUser

image

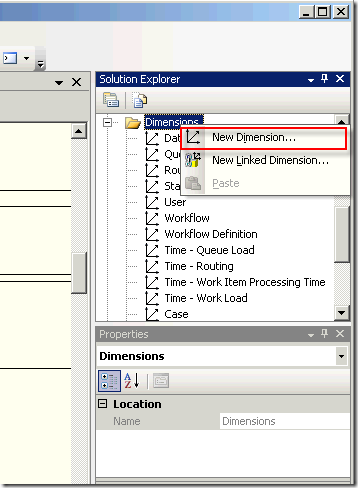
Save the changes. Now create new dimension:

Figure 14. Create new dimension

image

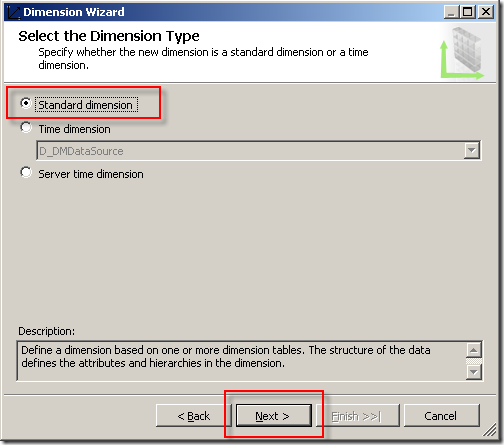
Keep the default values and click Next buttons in the pop-up Dimension Wizard dialog.

Figure 15. Choose standard dimension type

image

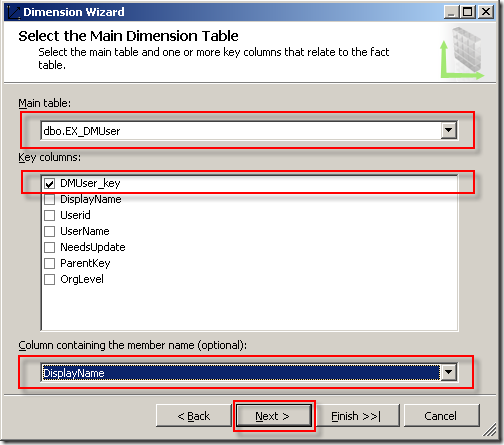
Until the step Select the Main Dimension Table, specify the view EX_DMUser, select DMUser_key as Key column, use DisplayName as member name column. Click Next.

Figure 16. Select the main dimension table

image

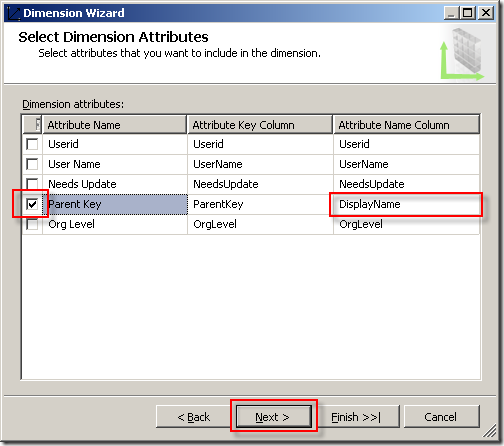
Include the Parent Key attribute in step Select Dimension Attributes.

Figure 17. Select dimension attributes

image

It’s a dimension of regular type.

Figure 18. Specify dimension type to regular

image

The wizard will find there may be Parent-Child Relationship in the dimension, select Parent Key here.

Figure 19. Define parent-child relationship

image

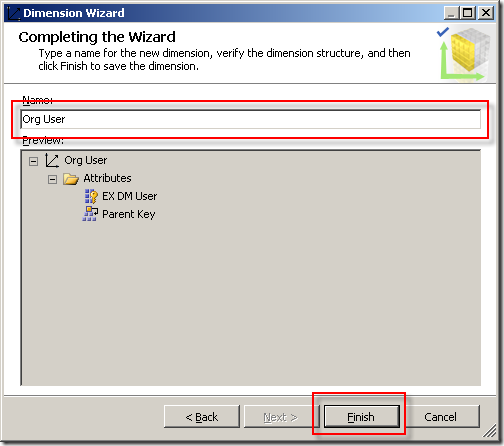
Name as Org User.

Figure 20. Name the dimension

image

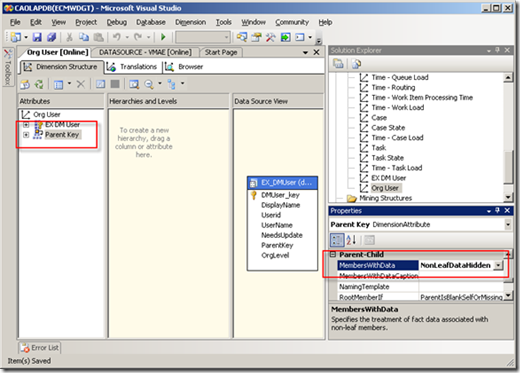
Open the just created Org User dimension, select Parent Key, and then change MembersWithData property to NonLeafDataHidden. Save the change.

Figure 21. Adjust dimension properties

image

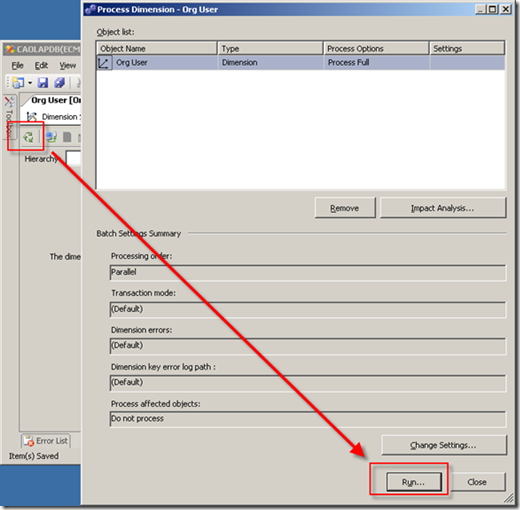
Switch to Browser tab, click Process button.

Figure 22. Process the dimension

image

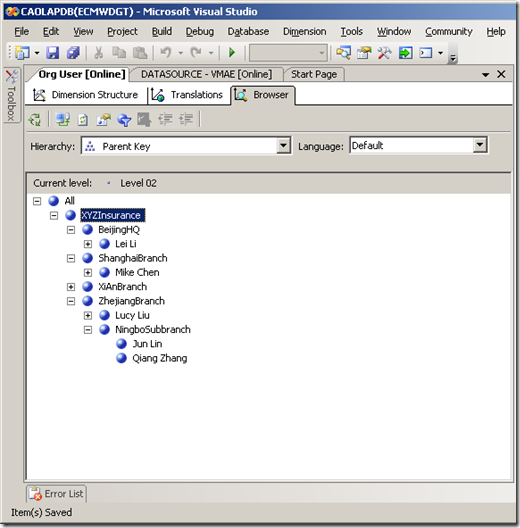
When processing finished, click the Reconnect or Refresh to preview the new dimension.

Figure 23. Preview the dimension

image

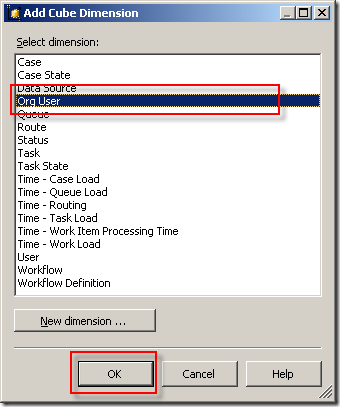
Now add the new dimension Org User into CA cube “Queue Load”.

Figure 24. Add the new dimension to a cube

image

Figure 25. Choose the Org User dimension to add

image

Save and let it process.

Figure 26. Save and process the cube

image

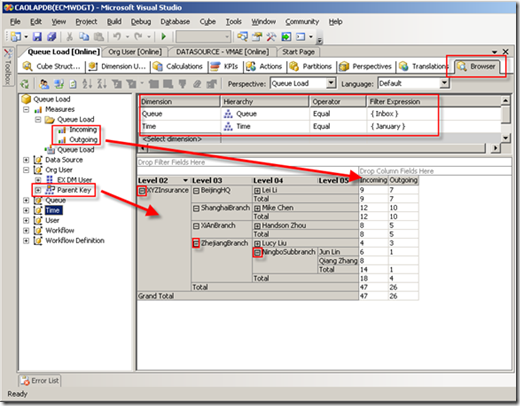
Finally check the updated cube in Browser tab, drag Parent Key of Org User to Row Field, add Incoming/Outgoing measures, and apply Queue/Time filters. Here is the result. You can see you may drill up or drill down freely in Org User dimension, and for higher level members, like branches/sub-branches, the measures are automatically summed.

Figure 27. Preview the cube with new dimension added

image

This updated cube can be either presented by Excel Pivot Table or Cognos BI.

As CA periodically extracts data and processes cubes, the cube data can be refreshed automatically. Above update won’t break the mechanism of CA itself.

Note that, in real use case, if an employee of company is transferred from one branch to another branch (or department), the LDAP data usually changes as well. The Java application that imports user/organization data should be re-invoked. After that, if you try to bring up old reports, you’ll find some branches’ Total changed. That’s because the Total value is calculated in OLAP’s runtime. Archive old reports to avoid this.


Summary

Above content not only gives a step by step description of how to implement an organization-user dimension that can drill up or drill down, but also explains the underlying principle, parent-child relationship in OLAP.

The next part 3 continues to introduce how to implement last month amount and month-on-month growth rate.


Appendix

Source: https://www.ibm.com/developerworks/mydeveloperworks/groups/service/html/communityview?communityUuid=e8206aad-10e2-4c49-b00c-fee572815374#fullpageWidgetId=Wf2c4e43b120c_4ac7_80ae_2695b8e6d46d&file=94a6ac16-3057-4e7c-8a1f-794f9a926b1a

File-pdf

Next part in series: IBM FileNet Case Analyzer Cubes’ Deep Customizations, Part 3: Last month amount, monthon-month growth rate

分类
English 原创作品 技术

IBM FileNet Case Analyzer Cubes’ Deep Customizations, Part 1: Introduction, business requirements and sample environment

IBM FileNet Case Analyzer Cubes’ Deep Customizations

Part 1: Introduction, business requirements and sample environment

XYZ Insurance Company as an Example

March 14, 2012

IBM

By Yiwei Song

Abstract: IBM FileNet Case Analyzer, formerly Process Analyzer, provides several cubes and corresponding Excel report templates by default. Reports can be customized by combining different dimensions, measures or calculations, and key data fields can be also appended as dimensions. However, in some customer cases, such customizations are not sufficient to meet specific requirements. This 5-article series introduces several ways of direct cube customizations. This article is the part 1 of series, gives an overall introduction, explains requirements and sets up the sample environment.

Yiwei Song, a member of CDL ECM CoE (Center of Excellence) in China, certified FileNet (4.0) developer. Has 5 years FileNet engagement experience, especially familiar with FileNet BPM. Acted as product expert and served several customer cases across insurance, banking and E&U industries. You may reach him at http://linkedin.com/in/yiweisong


Special Note

This 5-article series introduces 4 ways of cube customizations, which can achieve:

  • Organization-user drill up or drill down;
  • Last month amount, month-on-month growth rate;
  • Same month last year amount, monthly growth rate on a year-over-year basis;
  • 72-hour/7-day/30-day/3-month completion rate.

This article is the part 1 of series, gives an overall introduction, explains requirements and sets up the sample environment.


Prerequisites

This article assumes readers are familiar with IBM FileNet BPM 4.5.x or 5.0. Readers should have experience of using FileNet Case Analyzer (or formerly Process Analyzer). Additionally, readers should have basic knowledge of OLAP (i.e. Online Analytical Processing) and LDAP (i.e. Lightweight Directory Access Protocol).


Introduction to IBM FileNet Case Analyzer

IBM FileNet Case Analyzer (CA for short), formerly FileNet Process Analyzer, is a core component of FileNet BPM. The CA provides a mechanism of generating statistic reports from case/process history, which are important for customer to track the load of FileNet BPM based system, govern the organization performance and gain insights from process data.

CA provides various kinds of reports based on process data or case data. This article focuses on those based on process data. Case related reports are not in the scope.

CA provides reports (according to infoCenter http://publib.boulder.ibm.com/infocenter/p8docs/v5r0m0/topic/com.ibm.p8.pa.user.doc/bpfpa018.htm) like:

  • How much work is currently in a particular queue
  • How much new work entered the system during a time period
  • How much work was completed during a time period

CA reports can be either Excel Pivot Tables or Cognos BI reports.

Technically, CA depends heavily on OLAP. CA periodically extracts data from PE EventLog, does some ETL (Extraction Transformation Loading) and stores fact data in CA OLAP fact tables, then refreshes CA OLAP cubes. Excel or Cognos BI consumes these OLAP cubes and produces final reports.

Figure 1. Dataflow of Case Analyzer for process events

image

Reports generated by CA greatly benefit customers; however some customers still have particular requirements beyond existing CA OLAP cubes. OLAP cube customization can meet some typical requirements.

Customizations introduced in this article are applicable to either CA 5.x or PA 4.5.x. This article uses a mock company, XYZ Insurance Company as example, analyzes their requirements, and proposes workable solutions by customizing CA OLAP cubes.


XYZ Insurance Company’s requirement on process statistic report

XYZ Insurance Company (XYZ Insurance for short) is an insurance company in China. It runs life insurance business all over the country, so it has many branches or sub-branches in provinces and cities. All core systems related to business approval process are centralized and deployed in HQ operation center; branches access them via enterprise VPN. Standardized processes and systems help XYZ Insurance speed up their business. Beyond utilizing the process systems, the operations center generates companywide statistics report monthly, so that company and branch performance can be monitored.

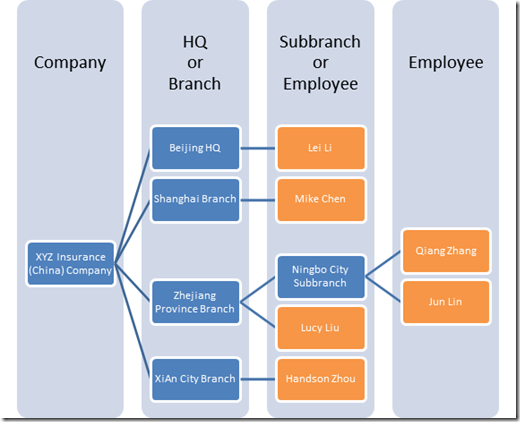
Here is a sample organizational graph of XYZ Insurance. Organizational units are in blue color, while employees are in orange color. Organization depth varies in different areas, resulting in an unbalanced organization tree.

Figure 2. Organizational chart of XYZ Insurance

image

There are 3 important processes within XYZ Insurance: IssuePolicy, Claim, and Surrender. In XYZ Insurance’s daily business, an employee in HQ, branch or sub-branch launches one process, an approver from HQ approves, and then the employee who launched the process does the final action.

The monthly reports XYZ Insurance needs are as follows:

  • Monthly ongoing/completed tasks by employee;
  • Monthly ongoing/completed tasks by branch/sub-branch;
  • Monthly companywide ongoing/completed processes by process type;
  • For each report, growth rate comparing last month and the same month last year;
  • Monthly average processing time of each step in a process;
  • Monthly 72-hour/7-day/30-day/3-month completion rate for each employee;
  • Yearly summary of all above monthly reports.


Solution Architecture

XYZ Insurance developed and deployed an insurance BPM system based on IBM FileNet platforms, which has the following architecture.

Figure 3. A brief architecture diagram of XYZ Insurance BPM System

image

The organization information is stored in Microsoft Active Directory. These 3 processes are implemented with FileNet BPM. FileNet BPM is connected to the same Active Directory. Below are the process definitions.

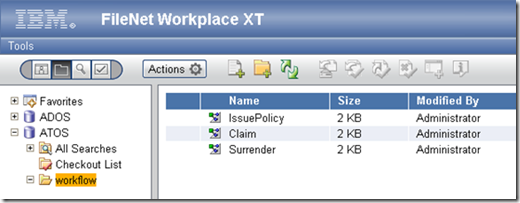
Figure 4. All 3 important processes of XYZ Insurance

image

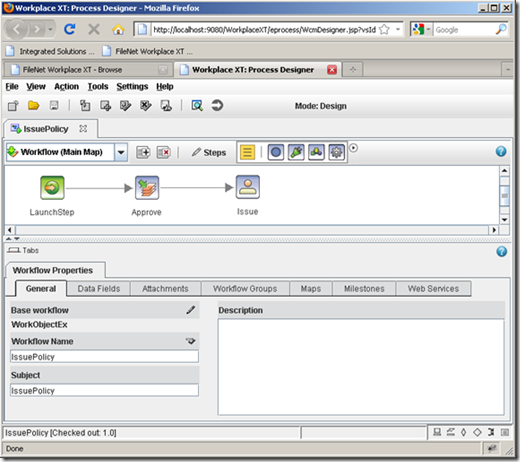
All three processes are simplified for this article. Each process contains 3 steps: LaunchStep, Approve and Issue/Claim/Surrender. The Approve steps are handled by the work queue ApproverQueue, the Issue/Claim/Surrender steps are handled by the user who launch the process, saying F_Originator. No data fields are added.

Figure 5. Simplified process definition for IssuePolicy process

image

All processes share the same DefaultEventLog.


Gap between CA product and requirement

Looking into XYZ Insurance’s report requirements some can be met using cubes and reports provided by Case Analyzer, but some cannot.

Table 1. XYZ Insurance’s report requirements comparing CA capabilities

Report

CA built-in?

Comment

Monthly ongoing/completed tasks by employee Yes Use the “Queue Load” cube
Monthly ongoing/completed tasks by branch/sub-branch No CA only provides a “flat” user dimension.
Monthly companywide ongoing/completed processes by process type Yes Use the “Workflow count” cube
Growth rate comparing last month and the same month last year in above reports No Seems meaningful but no such measure in CA
Monthly average processing time of each step in a process Yes Use the “Monthly Avg Step Processing Time” cube
Monthly 72-hour/7-day/30-day/3-month completion rate of each employee No Seems meaningful but no such measure in CA
Yearly summary of all above monthly reports Based on above reports

Fortunately, OLAP is an open technology and possible to customize.

This article shows how to produce these missing reports by customizing the CA cubes.


Sample environment setup

The article uses an all-in-one environment for simplicity. This all-in-one environment is based on a Microsoft Windows Server 2003 R2 Enterprise Edition, it covers the following mid-wares:

  • IBM DB2 9.7
  • IBM WebSphere Application Server v7.0
  • IBM FileNet CM 5.0
  • IBM FileNet PE 5.0
  • IBM FileNet Workplace XT
  • IBM FileNet Case Analyzer
  • Microsoft Active Directory
  • Microsoft SQL Server 2005 Enterprise Edition

Above mid-wares are properly installed and configured. FileNet CM and PE are installed on top of DB2, while Case Analyzer is installed on SQL Server.

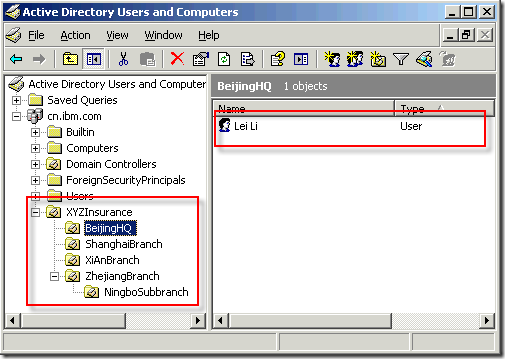
In Active Directory console, add organizational units and corresponding users listed in Figure 2. Make sure those accounts can be used to login to FileNet.

Figure 6. Organizational units and users in XYZ Insurance

image

Download the attached XYZInsurance_processes.zip archive file and extract 3 PEP process definitions from it. Bring up Workplace XT, login as administrator, and create a work queue named ApproverQueue in Process Configuration Console. Then transfer the PEP definitions to PE.

Login Workplace XT using different accounts of XYZ Insurance, randomly launch or complete the 3 processes. Once accumulated enough process data, manually turn the CA on to see whether cubes are processed correctly.


Prepare the LDAP user-organization importer

In the part 2 of the series, there will be a need to import user-organization information from LDAP to manually created dimension tables. This section helps prepare the importer application. If you’d like to skip part 2, skip this section as well.

Companies usually use LDAP to store organization information. As mentioned above, in this article Microsoft Active Directory embedded in Windows Server 2003 R2 Enterprise Edition is used. It doesn’t make too much difference to use other vender’s LDAP product, IBM Tivoli Directory Server is also a good candidate.

A customized Java application UserOrgSync is developed to read organization information from LDAP and write into above dimension tables.

This Java application is downloadable in article attachments. It’s packed as an Eclipse Java project archive. You may import it into Eclipse 3.7 IDE and check the source code. To compile the source code, you need to collect required libraries listed in /lib/readme.txt by yourself:

  • commons-collections-3.2.jar
  • commons-lang-2.5.jar
  • commons-logging-1.0.4.jar
  • commons-pool-1.5.4.jar
  • geronimo-jpa_3.0_spec-1.0.jar
  • geronimo-jta_1.1_spec-1.1.jar
  • log4j-1.2.15.jar
  • openjpa-1.2.2.jar
  • serp-1.13.1.jar
  • spring-ldap-core-1.3.1.RELEASE.jar
  • spring-ldap-core-tiger-1.3.1.RELEASE.jar
  • spring-ldap-test-1.3.1.RELEASE.jar
  • spring.jar
  • sqljdbc4.jar

The SQL for previous section can be found in the project:

  • /src/database/EX_DMOrg.sql
  • /src/database/EX_DMUserOrg.sql
  • /src/database/EX_DMUser.sql

After the tables and view created, you may make some adjustments, the LDAP and database connection arguments are specified in Spring configuration file:

  • /src/resource/context.xml

Double check the following lines in case you’re not using default values:

Listing 1. Spring context configuration XML in UserOrgSync project

<bean id=”processAnalyzerService” class=”com.ibm.cn.ecm.ca.ProcessAnalyzerService”>

……

<property name=”rootDn” value=”ou=XYZInsurance,dc=cn,dc=ibm,dc=com” />

</bean>

<bean id=”contextSource”

class=”org.springframework.ldap.core.support.LdapContextSource”>

<property name=”url” value=”ldap://localhost:389″/>

<property name=”userDn” value=”administrator@cn.ibm.com” />

<property name=”password” value=”filenet” />

……

</bean>

……

<bean id=”dataSource”

class=”org.springframework.jdbc.datasource.DriverManagerDataSource”

lazy-init=”true”>

……

<property name=”url” value=”jdbc:sqlserver://localhost:1433;” />

<property name=”username” value=”ca_client_user” />

<property name=”password” value=”filenet” />

</bean>

Do not run it until target dimension tables are created in part 2 of the series.

Let’s explain a little bit about the source code of the application.

This project leverages open source libraries, including Spring, Spring LDAP, OpenJPA, Apache Commons. Spring provides IoC container, Spring LDAP helps reading LDAP, OpenJPA and Spring JpaTemplate provides ORM and DB access abilities.

The key class of the project is com.ibm.cn.ecm.ca.ProcessAnalyzerService, the importOrgAndUser() method update organizational unit and user data in extended tables for CA. Internally it does the following operations:

  • Retrieve a tree of organizational units and users from LDAP;
  • Convert the tree to a new tree of Organization and UserOrganization;
  • Clear existing data in CA extended tables;
  • Persist the new tree into CA extended tables.
Listing 2. Implementation of importOrgAndUser() method

public void importOrgAndUser() {

OrgUserBuildingVisitor visitor = new OrgUserBuildingVisitor();

ldapTreeBuilder.getLdapTree(new DistinguishedName(rootDn)).traverse(visitor);

final Organization rootOrg = visitor.getRoot();

getJpaTemplate().execute(new JpaCallback() {

public Object doInJpa(EntityManager em)

throws PersistenceException {

em.getTransaction().begin();

Query clearUserOrgQuery = em.createQuery(“DELETE FROM UserOrganization u”);

clearUserOrgQuery.executeUpdate();

Query clearOrgQuery = em.createQuery(“DELETE FROM Organization o”);

clearOrgQuery.executeUpdate();

em.persist(rootOrg);

em.getTransaction().commit();

return null;

}

});

}

Above method leverages the OrgUserBuildingVisitor, which implements the Visitor design pattern. The OrgUserBuildingVisitor visits nodes of a LDAP tree and builds up a new tree with entities Organization and UserOrganization.

The service can be optimized in various aspects. For example, maybe not all users recorded in LDAP participate in the processes; the full organization-user tree will be an overhead. CA records a list of process users, so the service may retrieve it by using the SQL below, and then use it as a user filter when building the tree.

Listing 3. Filtering LDAP users by CA dimension data

SELECT UserName FROM D_DMUser WHERE Userid > 0


Summary

This part introduces IBM FileNet Case Analyzer and XYZ Insurance’s requirements, introduces solution architecture as context, and points out the gap between CA product and requirements. This part also explains how to setup a sample environment for later parts’ use.

The part 2 will continue to introduce how to implement an organization-user drill up or drill down in CA cubes.


Appendix

Source: https://www.ibm.com/developerworks/mydeveloperworks/groups/service/html/communityview?communityUuid=e8206aad-10e2-4c49-b00c-fee572815374#fullpageWidgetId=Wf2c4e43b120c_4ac7_80ae_2695b8e6d46d&file=cd0373b5-30b2-482c-a9d9-dd0c949f15f6

Download UserOrgSync project archive: UserOrgSync.without.libs.zip

Download sample processes archive: XYZInsurance_processes.zip


File-pdf

Next part in series: IBM FileNet Case Analyzer Cubes’ Deep Customizations Part 2: Organization-user drill up or drill down