分类
English 原创作品 技术

IBM FileNet Case Analyzer Cubes’ Deep Customizations, Part 5: Extending Case Analyzer Measures using Named Calculation

IBM FileNet Case Analyzer Cubes’ Deep Customizations, Part 5

Extending Case Analyzer Measures using Named Calculation

6/21/2012

IBM

Xue Bo Zhang and Yiwei Song

Abstract: This is the last part of the 5-article series. Other than parent-child relationship and calculated member mentioned in previous parts, this part introduces another important feature of OLAP, named calculation. The article explains how to create a 72-hour completion field by named calculation, and then create new measure based on this field. Finally the article gives a conclusion to the whole series.

About the authors:

Xue Bo Zhang is a software engineer in IBM China Software Development Lab (CSDL). He works on IBM Case Management development team. He has rich experience in Dojo and web 2.0. Reach out to him atzxuebo@cn.ibm.com

Yiwei Song, a member of CDL ECM CoE (Center of Excellence) in China, certified FileNet (4.0) developer. Has 5years FileNet engagement experience, especially familiar with FileNet BPM. Acted as product expert and served several customer cases across insurance, banking and E&U industries. You may reach him at http://linkedin.com/in/yiweisong

Link to the first part of the article:

Part 1 on Evis.ME | Part 1 on developerWorks

Link to the second part of this article:

Part 2 on Evis.MEPart 2 on developerWorks

Link to the third part of this article:

Part 3 on Evis.MEPart 3 on developerWorks

Link to the fourth part of this article:

Part 4 on Evis.MEPart 4 on developerWorks

This part produces the report: monthly 72-hour/7-day/30-day/3-month completion rate of each employee. Conclusion of the series is included at the end of the part.


Requirement analysis

A completion rate is an important statistic showing employee’s productivity. The 72-hour completion means, starting when a task is assigned to an employee, if the task is done within 72 hours, it’s counted one. So the 72-hour completion rate is calculated by: 72-hourCompletedAmount / AllCompletedAmount. The 7-day/30-day/3-month completion rates are similar.

Sure, there are no such measures in CA cubes. You may be thinking of Calculated Member. Unfortunately, none of measures in the CA cube Work Item Processing Time, like Time Usage Minutes, Completed Work Item Count, and Total Wait Time Minutes, can be really used for such calculated members. The reason is, all those measures are final statistics that hide related details. In order to get 72-hour completion amount, we need more “raw” data.

Fact tables contain enough raw data. Below sections will leverage fact tables and create Name Calculations.


Named Calculation in OLAP

A Named Calculation is a SQL expression represented as a calculated column. This expression appears and behaves as a column in the table. A named calculation extends the relational schema of existing tables or views in a data source view without modifying the tables or views in the underlying data source. Named calculations are calculated during processing whereas calculated members are calculated at query time. (http://msdn.microsoft.com/en-us/library/ms174859(v=sql.90).aspx)


Creating Named Calculation 72-hour completion

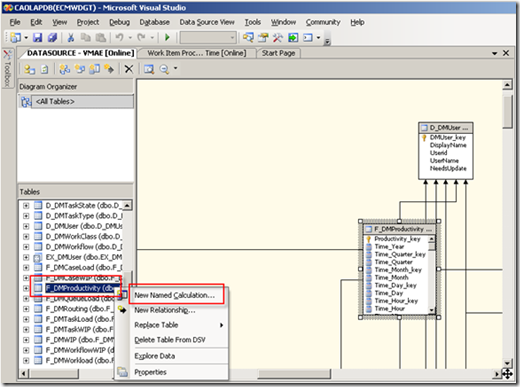
In BI Studio, open the data source view. Find the fact table F_DMProductivity in the view, right-click and click New Named Calculation.

Figure 1. Create new named calculation in F_DMProductivity table

image

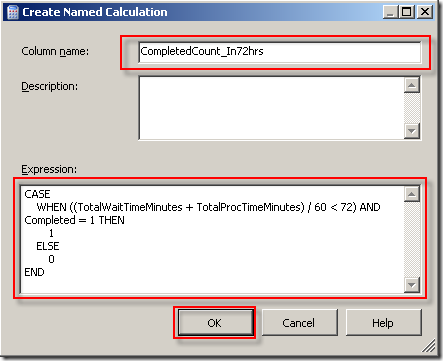
Specify Column name with CompletedCount_In72hrs, and Expression with the following SQL:

Listing 1. SQL for named calculation CompletedCount_In72hrs

CASE

WHEN ((TotalWaitTimeMinutes + TotalProcTimeMinutes)/60 < 72) AND Completed = 1 THEN

1

ELSE

0

END

Figure 2. Specify fields for new named calculation

image

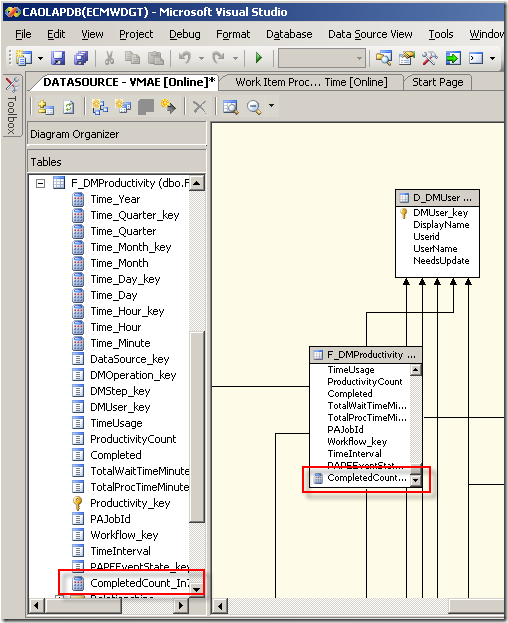
After clicked OK, a new Named Calculation is created.

Figure 3. Check the newly created named calculation

image

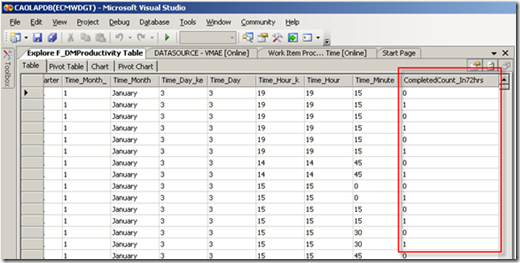
Right-click F_DMProductivity table and select Explore Data, check the new logical column:

Figure 4. Explore new column data of F_DMProductivity table

image


Creating new Measure and Calculated Member based on the Name Calculation in the cube

This section will leverage the newly created Calculated Member CompletedCount_In72hrs in the cubes.

Open the CA cube Work Item Processing Time again in BI Studio. Create New Measure by choosing from context menu.

Figure 5. Create new measure

image

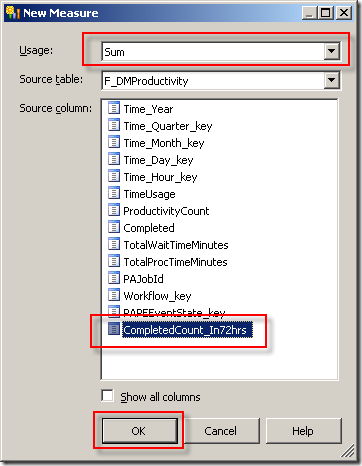
Specify Usage with Sum, Source column with CompletedCount_In72hrs. Click OK.

Figure 6. Choose usage and source column for the new measure

image

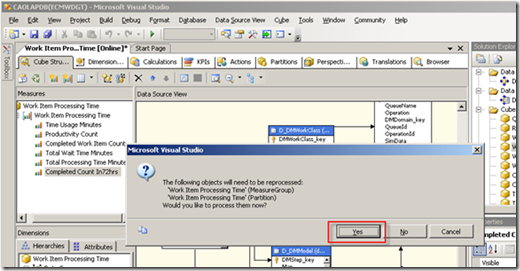
When saving the change, BI Studio prompts to reprocess, choose Yes.

Figure 7. Save and process the cube

image

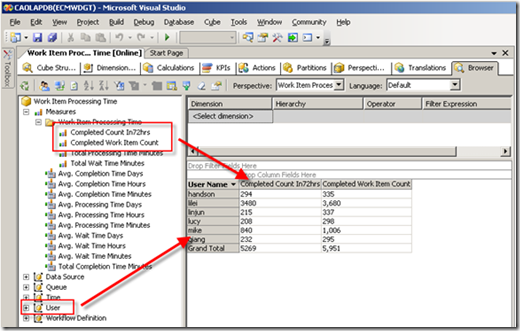
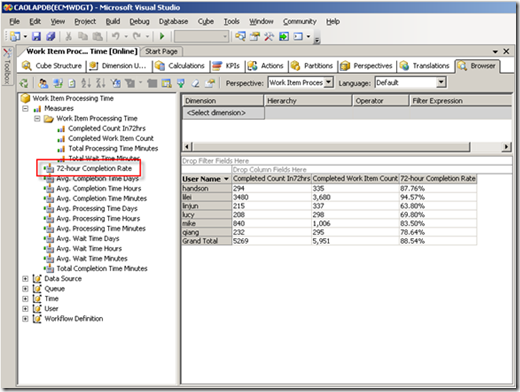
Then preview in Browser tab. As comparison, both Completed Count In72hrs and the original Completed Work Item Count measures are added.

Figure 8. Preview the cube with new measure Completed Count In72hrs

image

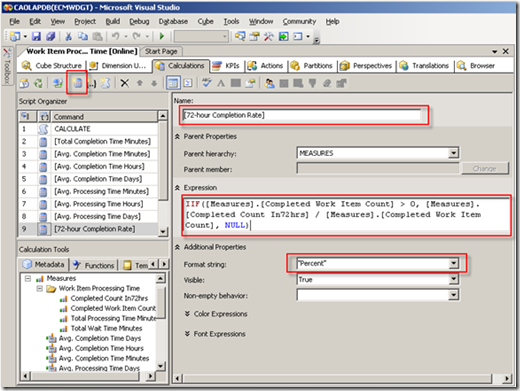
Now create a new Calculated Member based on this measure in the same cube. Name is [72-hour Completion Rate], Format string is “Percent”, and Expression is:

Listing 2. MDX for calculated member 72-hour Completion Rate

IIF( [Measures].[Completed Work Item Count]>0, [Measures].[Completed Count

In72hrs]/[Measures].[Completed Work Item Count], NULL)

Figure 9. Create new calculated member

image

Save and preview. You may see linjun’s productivity is relatively poor and lilei is playing excellently.

Figure 10. Preview the cube with calculated member 72-hour Completion Rate

image

The 7-day/30-day/3-month completion rates are similar. We won’t repeat here.

Note: This completion rate solution doesn’t consider the weekends or public holidays, some employees may raise their concerns saying “my 72-hour completion rate is low because many of my tasks come on Friday, I finish them in the next Monday already”. This is out of the scope of the article.


Conclusion

In this article series, we leverage OLAP features drill-up/drill-down, calculated member, and name calculation to customize Case Analyzer’s cubes, so that more reports with more business value can be achievable.

Again, it’s not necessary to worry about customer may do extra operations when creating monthly report, since above customizations won’t break CA’s mechanism. Data of newly created members/measures will change automatically except for the LDAP information import (in part 2).

CA cubes can be either presented by Excel Pivot Table, Cognos BI, or any other OLAP clients. If you buy Cognos BI because of this article please give me some credit (just kidding).

CA’s underlying OLAP technology is open. This article only unleashes a little piece of it. Readers are encouraged to extend and explore more possibilities. Any comments and new ideas are welcome.


Resources

IBM FileNet infoCenter

FileNet Case Analyzer

LDAP

OLAP

Microsoft SQL Server Analysis Services


Appendix

Source: https://www.ibm.com/developerworks/mydeveloperworks/groups/service/html/communityview?communityUuid=e8206aad-10e2-4c49-b00c-fee572815374#fullpageWidgetId=Wf2c4e43b120c_4ac7_80ae_2695b8e6d46d&file=e610b662-31f5-4a8a-8953-84d74e0e10b8

File-pdf

分类
English 原创作品 技术

IBM FileNet Case Analyzer Cubes’ Deep Customizations, Part 4: Same month last year amount, monthly growth rate on a year-over-year basis

IBM FileNet Case Analyzer Cubes’ Deep Customizations

Part 4: Same month last year amount, monthly growth rate on a year-over-year basis

A Workaround for CA Time Dimension Restrictions

5/16/2012

IBM

Jie Zhang & Yiwei Song

Abstract: This is part 4 of series, focuses on the report same month last year amount and monthly growth rate on a year-over-year basis. This part analyzes XYZ Insurance’s requirement, outlines a restriction in CA Time dimension, and gives a workaround to overcome this restriction.

Zhang Jie works as a software engineer in IBM CDL. He has many years’ experiences of Java/J2EE development, test and test automation. Reach out to him atzhjie@cn.ibm.com

Yiwei Song, a member of CDL ECM CoE (Center of Excellence) in China, certified FileNet (4.0) developer. Has 5 years FileNet engagement experience, especially familiar with FileNet BPM. Acted as product expert and served several customer cases across insurance, banking and E&U industries. You may reach him athttp://linkedin.com/in/yiweisong


Link to the first part of the article:

Part 1 on Evis.ME | Part 1 on developerWorks

Link to the second part of this article:

Part 2 on Evis.MEPart 2 on developerWorks

Link to the third part of this article:

Part 3 on Evis.MEPart 3 on developerWorks

This part continues the topic of last one, focuses on same month last year amount and monthly growth on a year-over-year basis.


Requirement analysis

The same month last year amount and monthly growth on a year-over-year basis statistic is a typical report requirement and is important to company management. For example, there are 358 IssuePolicy businesses happened in Jan 2013 and 88 in Jan 2012, the growth on a year-over-year basis is (358 – 88) / 88 = 306.8%, which shows quite a promising rate.

Actually, in MDX or SSAS, there are many Time dimension optimized operations or functions. PARALLELPERIOD is a MDX function that can retrieve a member from a prior period in the same relative position as a specified member.

So the first trial is quite straightforward. Create a new Calculated Member Same Month Last Year Incoming with the MDX below:

Listing 1. Expected MDX locating Same Month Last Year

([Measure].[Incoming],PARALLELPERIOD([Time].[Time].[Year]))

The Browser result is as follows.

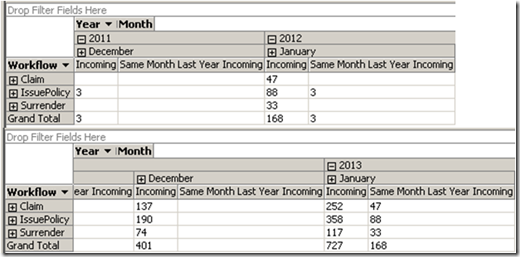
Figure 1. Unexpected data found in Jan 2012 and Dec 2012

image

Comparing Jan 2013 and Jan 2012, the Same Month Last Year Incoming works well. But for Dec 2012 and Dec 2011, the values are missing, at least a “3-IssuePolicy” value. Actually, the test data doesn’t contains any of Jan 2011, so the “3-IssuePolicy” value in Jan 2012 is not right, seems it takes the value from Dec 2011 instead. Similarly, corresponding value in Dec 2012 is empty, which is incorrect.

This problem is also caused by CA’s bypassing non-activity months. Just as mentioned in last chapter, the members of Time dimension in CA cubes may not be consecutive. The PARALLELPERIOD function tries to locate the month with the same index in last year, however such index may not equal to the month number in CA’s case.

A workaround is needed.


Creating Calculated Member Same month last year amount in CA cubes

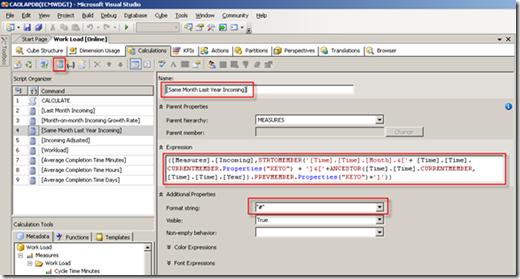
A Time dimension member at Month level can be presented as “[Time].[Time].[Month].&[2]&[2012]”, while the “&[2]&[2012]” suffix corresponds to composite key of the Month level. The idea is to get both current month key and last year key from current member, and then use those keys to find same month last year member.

Create new Calculated Member in the same cube. The Name is [Same Month Last Year Incoming], the Format string is “#”, and the Expression is:

Listing 2. New MDX expression for Same Month Last Year Incoming

([Measures].[Incoming], STRTOMEMBER(‘[Time].[Time].[Month].&[‘ +

[Time].[Time].CURRENTMEMBER.Properties(“KEY0”) + ‘]&[‘ +

ANCESTOR([Time].[Time].CURRENTMEMBER,

[Time].[Time].[Year]).PREVMEMBER.Properties(“KEY0”) + ‘]’))

Figure 2. Create new calculated member Same Month Last Year Incoming

image

The ANCESTOR function goes up and gets the Year-level member containing current Month member.

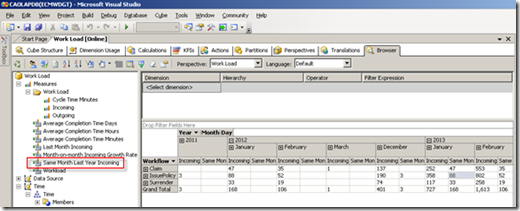
Preview in Browser tab. The problem of last section is resolved.

Figure 3. Preview the cube with new calculated member Same Month Last Year Incoming

image


Creating Calculated Member Monthly growth rate on year-over-year basis in CA cubes

There won’t be any difficulties creating this Calculated Member.

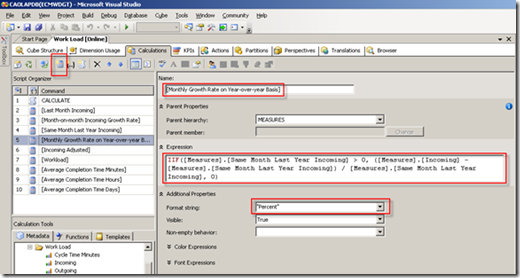
The Name is Monthly Growth Rate on Year-over-Year Basis, the Format string is “Percent”, and the Expression is:

Listing 3. MDX expression for Monthly Growth Rate on Year-over-Year Basis

IIF([Measures].[Same Month Last Year Incoming] > 0, ([Measures].[Incoming] –

[Measures].[Same Month Last Year Incoming]) / [Measures].[Same Month Last Year

Incoming], 0)

Figure 4. Create new calculated member Monthly Growth Rate on Year-over-Year Basis

image

Preview in Browser tab:

Figure 5. Preview the cube with calculated member Monthly Growth Rate on Year-over-Year Basis

image


Summary

Most products have restrictions, though those restrictions are reasonable for most cases in a product perspective. However customers won’t always accept those restrictions. A workaround is a way of maximizing products’ potential.

This part gives two possible options of implementing the report same month last year amount and monthly growth on a year-over-year basis. Both solutions leverage OLAP calculated member. The former solution is not applicable due to the CA Time dimension’s restrictions, while the later one can be considered as a good workaround.

Next part will be based on another different OLAP feature.


Appendix

Source: https://www.ibm.com/developerworks/mydeveloperworks/groups/service/html/communityview?communityUuid=e8206aad-10e2-4c49-b00c-fee572815374#fullpageWidgetId=Wf2c4e43b120c_4ac7_80ae_2695b8e6d46d&file=70af4375-b812-4972-9e13-2636f58a080d

File-pdf

Next part in series: IBM FileNet Case Analyzer Cubes’ Deep Customizations, Part 5: Extending Case Analyzer Measures using Named Calculation

分类
English 原创作品 技术

IBM FileNet Case Analyzer Cubes’ Deep Customizations, Part 3: Last month amount, month-on-month growth rate

IBM FileNet Case Analyzer Cubes’ Deep Customizations

Part 3: Last month amount, month-on-month growth rate

[Calculated Member in OLAP]

[May 9, 2012]

IBM

Shi Peng & Yiwei Song

Abstract: This is part 3 of the series, focuses on the report Last month amount and month-on-month growth rate. This part analyzes XYZ Insurance’s requirement, lists cons of Excel Pivot Table solution, introduces calculated member in OLAP and how to implement the calculated members required by the report.

Peng Shi previously worked as advisory software engineer in IBM China Software Development Lab Enterprise Content Management Center of Excellence. Currently, he works as the Knowledge Management Center senior manager in New Oriental Education and Technology Group in China. Reach out to her atshipeng3@xdf.cn.

Yiwei Song, a member of CDL ECM CoE (Center of Excellence) in China, certified FileNet (4.0) developer. Has 5 years FileNet engagement experience, especially familiar with FileNet BPM. Acted as product expert and served several customer cases across insurance, banking and E&U industries. You may reach him at http://linkedin.com/in/yiweisong.

Link to the first part of the article:

Part 1 on Evis.ME | Part 1 on developerWorks

Link to the second part of this article:

Part 2 on Evis.MEPart 2 on developerWorks

This part and next part explains how to create an important statistic for the reports: Growth rate comparing to last month and same month last year. This kind of statistic is applicable to most reports; let’s take process amount growth rate as example.


Requirement analysis

When creating a report of process (i.e. workflow instance) amount by process type, CA’s cube Work Load is the best choice. This cube includes dimensions Workflow and Time, measures Incoming, Outgoing, WL (i.e. Work Load) and etc.

Assume the customer is generating a report for Feb 2013, the Workflow dimension as rows, and the Incoming measure as column. Beyond this, customer needs an extra column showing Incoming amount of last month, Jan 2013, as well as a column showing the growth rate between Jan and Feb. So that customer may have the idea of their business growth in short term.

It’s definitely doable to use Excel’s power to achieve this.

  1. “Flatten” the Pivot Tables in Jan 2013 and Feb 2013 reports.
  2. Use Jan 2013 worksheet as base>copy Incoming column from Feb 2013 as another column, of course, a precondition in the Workflow rows Jan 2013 and Feb 2013 worksheets should be same.
  3. Create a new column with a function specified, and format as percentage.

Result is as follows:

Figure 1. Sample sheet of month-on-month growth in Excel

image

However, it’s not a good way to calculate in Excel because:

  • The Excel Pivot Table doesn’t allow complex manipulations; the“flatten” operation is a must.
  • “Flatten” and merging have to be done manually or by some script.
  • Workflow row correspondence cannot be guaranteed.
  • Most importantly, we expect to tune the data source rather than a presentation.

What if customer has Cognos BI or other OLAP clients as alternative presentations?

It is the best if the Work Load cube also provides measures Last Month Incoming and Month-on-month Incoming Growth Rate. The section below will try to adjust the Work Load cube by adding calculated members.


Calculated Member in OLAP

Calculated member is a customized measure or dimension member, defined by combining cube data, arithmetic operators, numbers, and functions. For example, we can create a calculated member named CNY (Chinese Yuan) that converts USD dollars to CNY by multiplying an existing USD measure by a conversion rate. CNY can then be displayed to end users in a separate row or column.

For a calculated member, its values are presentable but exist only in memory, which are not stored as cube data. (Referred to http://technet.microsoft.com/en-us/library/ms174952(SQL.90).aspx)


Creating Calculated Member last month amount in the cube

Here two calculated members will be created

  • Last Month Incoming and
  • Month-on-month Incoming Growth Rate

1. Again, bring up BI Studio, then connect to the same OLAP database or simply open recent project if you’ve created it in the last chapter.

Figure 2. Open existing solution in BI Studio

image

2. Open the Work Load cube>witch to Calculations tab.

Figure 3. Calculations tab of a cube

image

3. Click New Calculated Member button to create new Calculated Member.

Figure 4. Create new calculated member

image

4. Specify Name with [Last Month Incoming], Format string with “#”, fill Expression field with the following MDX expression.

Figure 5. Specify necessary fields of the new calculated member Last Month Incoming

image

Here is the MDX expression:

Listing 1. MDX expression for calculated member Last Month Incoming

IIF([Time].[Time].LEVEL IS [Time].[Time].[Month],

IIF([Time].[Time].CURRENTMEMBER.Properties(“KEY0”) –

[Time].[Time].PREVMEMBER.Properties(“KEY0”) = 1 OR

[Time].[Time].CURRENTMEMBER.Properties(“KEY0”) –

[Time].[Time].PREVMEMBER.Properties(“KEY0”) = -11,

([Measures].[Incoming],[Time].[Time].PREVMEMBER),

“0”),

“N/A”)

The outer IIF function judges whether the level of current dimension member is the month. If not, the expression returns “N/A”. It doesn’t make any sense to calculate the Last Month Incoming at year or day level.

Typically, in a Time dimension, all the members should be consecutive, like Dec (2012), Jan (2013), Feb, Mar, Apr, etc., so that MDX PREMEMBER function will definitely return to the last month. However, there is a possible exception in CA cubes. CA only processes those times which PE has process related activities. That is to say, in some certain month, there is not a single user or systems operate the PE, CA will bypass this month, the member of this month won’t exist. For example, we may find there is Oct (2012), Nov (2012), Jan (2013), Feb (2013) members in Month level of Time hierarchy, Dec (2012) is missing, maybe all employees are on vacation at the same time, who knows? There should be a Dec member indicating there are 0 incoming processes, but due to underlying design, CA just bypasses it. As a result, PREMEMBER won’t be safe.

The inner IIF function in above MDX expression handles such exception. The condition argument compares current month member and previous month member, to see if the two are consecutive. A Properties(“KEY0”) property converts month string value to number value, like “Feb” to 2, “Dec” to 12, so that the “-” operator can be used. The later “-11” condition implies current month is Jan and previous month is Dec. The return value is either incoming measure of previous month or a “0”.

Save the change, and then switch to Browser tab. Add Year and Month of Time dimension as columns, Workflow of Workflow dimension as rows, and add both Incoming and Last Month Incoming as measures. You can see the value of Last Month Incoming of a month is exactly the same as Incoming of previous month, while if previous month is missing, the Last Month Incoming will be “0”.

Figure 6. Preview the cube with new calculated member

image

You may hide Subtotal columns in context menu if you find it disturbing.

Figure 7. Hide the subtotal column of a level

image

You also need to check using levels other than Month level in Time dimension. It shows “N/A” as expected to avoid confusing.

Figure 8. The “N/A” value works well

image


Creating Calculated Member month-on-month incoming growth rate

A month-on-month growth is calculated by: (Current – Last)/Last, which is easy to achieve by Calculated Member.

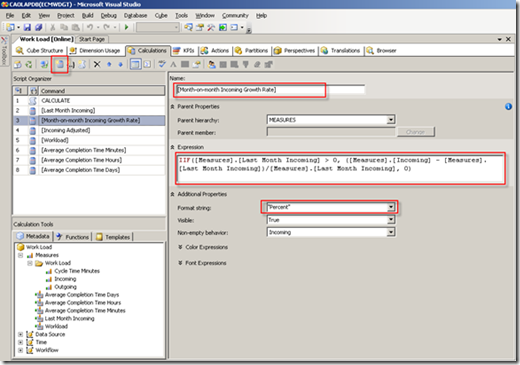
Create new Calculated Member in same Work Load cube, and then specify Name with [Month-on-month Incoming Growth Rate], Format string with “Percent”, Expression with the following MDX:

Figure 9. Create new calculated member Month-on-month Incoming Growth Rate

image

Listing 2. MDX expression for calculated member Month-on-month Incoming Growth Rate

IIF([Measure].[Last Month Incoming] > 0,

([Measure].[Incoming] – [Measure].[Last Month Incoming])/[Measure].[Last Month

Incoming],

0)

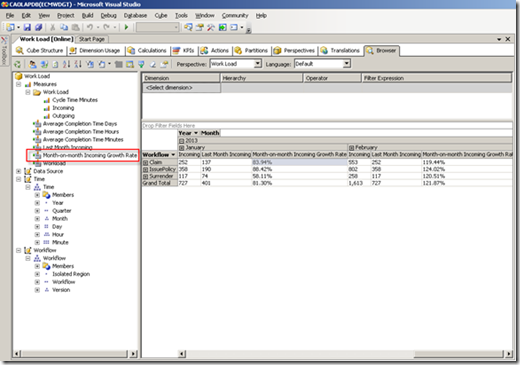
Append Month-on-month Incoming Growth Rate measure in Browser and check the result.

Figure 10. Preview the cube with new calculated member Month-on-month Incoming Growth Rate

image

Note: The MDX expression above is simplified. Developers should consider current level and “N/A” hints as last section mentioned, as well as other optimizations.


Summary

This part implements the last month amount and month-on-month growth rate reports, which shows a different method of extending CA dimensions and cubes. Calculated member is widely used when calculations are needed on top of existing measures.

In the next part 4, calculated member is still the core, however some restrictions of CA block us from a straightforward implementation. It’s worthwhile to outline these restrictions and corresponding workarounds.


Appendix

Source: https://www.ibm.com/developerworks/mydeveloperworks/groups/service/html/communityview?communityUuid=e8206aad-10e2-4c49-b00c-fee572815374#fullpageWidgetId=Wf2c4e43b120c_4ac7_80ae_2695b8e6d46d&file=ba70f3c8-d5c1-4bde-a837-45650481ca9a

File-pdf

Next part in series: IBM FileNet Case Analyzer Cubes’ Deep Customizations, Part 4: Same month last year amount, monthly growth rate on a year-overyear basis